Showing posts with label meter. Show all posts

Wednesday, November 19, 2014

Measure your stress level – Tension meter

If you, like so many other people in this day and age, arrive home from work stressed out and with the problems of the day still lingering,this simple little instrument will go a long way to relieving nervous tension.
Of the various types of feedback devices, probably the best approach for the amateur experimenter is the Galvanograph, better known as the Galvanic Skin Response Monitor. The instrument described here relies for its operation on changes in skin resistance in sympathy with changes in emotional state. An increase in tension level reduces skin resistance and, conversely, a decrease in tension is accompanied by an increase in skin resistance.
The correlation between emotional stress and skin resistance is still not fully understood. What is known, though, is that minute changes in the permeability of the skin produce corresponding voltage variations across two electrode pads attached to two fingers on the same hand.

Measure


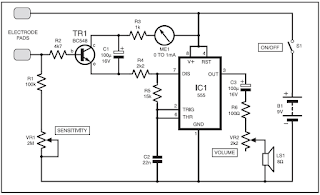
Tension Monitor meter circuit

These signal fluctuations are amplified and fed to an oscillator to produce an audible tone. A decrease in pitch therefore signifies a decrease in tension, and vice-versa. A visual indicator in the form of a panel meter also aids the user in monitoring tension levels. The monitor is quite sensitive to fluctuations. During use, a sudden moment of stress, even a deep sigh, will increase the pitch and cause a shift of the meter needle. Circuit Details In the circuit diagram of Fig.1, IC1 is configured as an astable multivibrator to drive an 8-ohm miniature speaker LS1 via capacitor C3, resistor R6 and volume control potentiometer VR2. The latter allows users to set a desired level and avoid it becoming a distraction.
Whereas the trigger input of IC1 is normally connected to the positive rail via a resistor in a conventional 555 oscillator, here it is connected via resistor R4 to the emitter of transistor TR1. The base of TR1 is connected between one electrode pad and the voltage divider formed by potentiometer VR1 and resistor R1. It will be seen that with the pads fitted to the fingers, the tone level will be dependent on the setting of VR1 and skin resistance. Resistor R2 in the transistor base is necessary should the pads be accidentally touched together. A 1mA meter is fitted in the collector line, along with R3, as a visual indicator. Although not essential or intended to measure current levels, it does help to emphasize fluctuations in emotional level.
The design of the pads is not critical. For the prototype, stripboard was used. The tracks were wired together at one end and connected to a 30cm length of twin lighting flex. The pads were then glued to Velcro straps. When the unit is first switched on, a highpitched tone should be heard, rapidly diminishing and ceasing. Turn the Sensitivity control VR1 to the minimum setting. Attach the electrodes to the fleshy pads of the first two fingers on the less-dominant hand with the Velcro straps, firmly but not tight. Rest the hand comfortably and keep it reasonably still, allowing half a minute for the pads to “bond”. Normally, at the minimum setting, the oscillator will hardly tick over, unless the user is in a high state of anxiety. Keep in mind that any form of stimulant, and that includes tea, coffee, alcohol and cigarettes, will reduce one’s capacity to relax. Rotate the control until a medium pitched tone is obtained and apply your relaxation technique. The monitor does not teach any method of meditation or relaxation; it only monitors the effectiveness of the technique applied. The tone should slowly diminish, with fluctuations as unconscious thoughts flit across the mind.When the sound ceases altogether, repeat the above procedure by increasing VR1. Twenty minutes is considered by therapists to be an adequate relaxation session.
Read More..

Friday, November 7, 2014

Simple Stereo VU Meter

I like to see lights move to music. This project will indicate the volume level of the audio going to your speakers by lighting up LEDS. The LEDS can be any color so mix them up and really make it look good. The input of the circuit is connected to the speaker output of your audio amplifier. You want to build two identical units to indicate both right and left channels. The input signal level is adjusted by the 10k ohm VR. If you wish to make a very large scale model of this unit and hang it on your wall there is an optional output transistor that can drive many LEDS at once. The unit I built drove three LEDS for each output. The sequence of the LEDS lighting are as follows Pin 1, 18, 17, 16, 15, 14, 13, 12, 11, 10.
Read More..

Thursday, November 6, 2014

8 Stage LED VU Meter

The circuit below uses two quad voltage comparators (LM339) to illuminate a series of 8 LEDs indicating volume level. Each of the 8 comparators is biased at increasing voltages set by the voltage divider so that the lower right LED comes on first when the input is about 400 millivolts or about 22 milliwatts peak in an 8 ohm system.

8 Stage LED VU Meter Circuit diagram : 

 vu meter-circuit daigram

The divider voltages are set so that each LED represents about twice the power level as the one before so the scale extends from 22 milliwatts to about 2.5 watts when all LEDs are lit. The sensitivity can be decreased with the input control to read higher levels. I have not built or tested this circuit, so please let me know if you have problems getting it working. The power levels should be as follows:
  • 1 LED = 22mW
  • 2 LEDs = 42mW
  • 3 LEDs = 90mW
  • 4 LEDs = 175mW
  • 5 LEDs = 320mW
  • 6 LEDs = 650mW
  • 7 LEDs = 1.2 Watts
  • 8 LEDs = 2.5 watts

Read More..

Sunday, October 5, 2014

PIC Dual Temperature Meter by PIC16F628

PIC

This is extremely simple to build PIC Temperature meter that allows to measure temperature in two different locations at the same time. Never before such a useful and powerful circuit could be built with so little components and yet provide endless possibilities. This is all possible thanks to the use of PIC16F628 microcontroller and 2×16 character LCD display that act like a small computer which can be customizable thanks to upgradeable hex firmware.

Presented PIC temperature meter uses two very exciting DS18S20 digital temperature sensors that come in convenient TO92 package. Unlike regular sensors where temperature readings are passed as varying voltage, DS18S20 passes temperature information in a digital format as data. This brings many new possibilities and enables to pass temperature information over much longer distances just over a two wire cable. With this temperature can be measured in different locations at the same time and away from the main circuit board. With regular sensors which rely on the varying voltage cables must be as short as possible because longer wires introduce stray resistance that bring unreliable readings.

Read More..

Wednesday, October 1, 2014

Analogue Frequency Meter Circuit

This proposed analogue frequency meter circuit may be used as a pulse counter, tachometer, or if preceded by a Schmitt trigger, an analogue frequency meter.
Output linearity better than 2% can be obtained with duty cycles of less than 30%. The meter is selected so that it reads full scale when the duty cycle of the UL914 is 30%. The choice of C1 and the meter sensitivity determines the range of measurement. Potentiometer RV1 is used to calibrate the meter to full scale deflection, and resistor R2 counteracts the slight zero offset of the saturated lC. Diode D1 protects the meter. 


Read More..

Saturday, September 13, 2014

16 × 2 LCD Volt Meter Ampere Meter With PIC

Volt meters & ampere meter with PIC can be used to measure voltage and current simultaneously. The series of volt meters & ampere meter with PIC16F876A PIC is used as a data processor voltage and current are measured. 


This circuit uses the viewer in the form of 16 × 2 LCD used for the data display voltage and current measurements. In the article volt meter and ampere meter with PIC are discussed kerannya limited to devices only. More detail can be seen from the image sequence volt meter and ampere meter with PIC below. 

The images of Volt Meter & Ampere Meter With PIC Circuit

Volt meters & ampere meter with PIC 

Read More..

Wednesday, September 10, 2014

VHF field strength meter


This is a simple and low cost wide band VHF field strength meter. The field strength is measured by converting the radio signal to DC and measuring it.


The RF signal will be picked up by the coil and rectified by the diode D1.Even a very small DC voltage is sufficient to alter the biasing of FET and it will be reflected in the meter as an indication of the presence of a radio signal. The meter can be calibrated by adjusting the preset R2 to make meter M1 read ZERO in the absence of any radio signal. This schema is not very sensitive, but can sense radio signals from hand held FM transmitters up to a distance of few meters( ideal for theoretical demonstrations).


Notes.

* The schema can be assembled on a general purpose PCB.
* Use a 9V PP3 battery for powering the schema.
* Use a 250uA FSD current meter for M1.Using a lower FSD meter will improve sensitivity.
* The coil L1 can be made by making 6 turns of 20 SWG enameled copper wire on a inch plastic former.
* The antenna can be a telescopic whip antenna.

Read More..

Saturday, August 30, 2014

Save Your Ears A Noise Meter

‘Hello… HELLO! Are you deaf? Do you have disco ears?’ If people ask you this and you’re still well below 80 , you may be suffering from hearing loss, which can come from (prolonged) listening to very loud music. You won’t notice how bad it is until it’s too late, and after that you won’t be able to hear your favorite music the way it really is – so an expensive sound system is no longer a sound investment. To avoid all this, use the i-trixx sound meter to save your ears (and your neighbors ears!).
With just a handful of components, you can build a simple but effective sound level meter for your sound system. This sort of schema is also called a VU meter. The abbreviation ‘VU’ stands for ‘volume unit’, which is used to express the average value of a music signal over a short time. The VU meter described here is what is called a ‘passive’ type. This means it does not need a separate power supply, since the power is provided by the input signal. This makes it easy to use: just connect it to the loudspeaker terminals (the polarity doesn’t matter) and you’re all set.
The more LEDs that light up while the music is playing, the more you should be asking yourself how well you are treating your ears (and your neighbours’ ears). Of course, this isn’t an accurately calibrated meter. The schema design is too simple (and too inexpensive) for that. However, you can have a non-disco type (or your neighbors) tell you when the music is really too loud, and the maximum number of LED lit up at that time can serve you as a good reference for the maximum tolerable sound level.
Although this is a passive VU meter, it contains active components in the form of two transistors and six FETs. Seven LEDs light up in steps to show how much power is being pumped into the loudspeaker. The steps correspond to the power levels shown in the schematic for a sine-wave signal into an 8-ohm load. LED D1 lights up fi rst at low loudspeaker voltages. As the music power increases, the following LEDs (D2, D3, and so on) light up as well. The LEDs thus dance to the rhythm of the music (especially the bass notes).
Circuit diagram:
noise Noise Meter Circuit Diagram
This schema can easily be assembled on a small piece of prototyping board. Use low-current types for the LEDs. They have a low forward voltage and are fairly bright at current levels as low as 1 mA. Connect the VU meter to the loudspeaker you want to monitor. If LED D2 never lights up (it remains dark even when LED D3 lights up), reverse the polarity of diode D8 (we have more to say about this later on). In addition, bear in mind that the sound from the speaker will have to be fairly loud before the LEDs will start lighting up.
If you want to know more about the technical details this VU meter, keep on reading. Each LED is driven by its own current source so it will not be overloaded with too much current when the input voltage increases. The current sources also ensure that the final amplifier is not loaded any more than necessary. The current sources for LEDs D1–D6 are formed by FET diagram. A FET can be made to supply a fixed current by simply connecting a resistor to the source lead (resistors R1–R6 in this case). With a resistance of 1 kΩ, the current is theoretically limited to 1 mA. However, in practice FETs have a especially broad tolerance range. The actual current level with our prototype ranged from 0.65 mA to 0.98 mA.
To ensure that each LED only lights up starting at a defined voltage, a Zener diode (D8–D13) is connected in series with each LED starting with D2. The Zener voltage must be approximately 3 V less than the voltage necessary for the indicated power level. The 3-V offset is a consequence of the voltage losses resulting from the LED, the FET, the rectifier, and the over voltage protection. The over voltage protection is combined with the current source for LED D7. One problem with using FETs as current sources is that the maximum rated drain–source voltage of the types used here is only 30 V.
If you want to use the schema with an especially powerful fi nal amplifier, a maximum input level of slightly more than 30 V is much too low. We thus decided to double the limit. This job is handled by T7 and T8. If the amplitude of the applied signal is less than 30 V, T8 buffers the rectified voltage on C1. This means that when only the first LED is lit, the additional voltage drop of the over voltage protection schema is primarily determined by the base–emitter voltage of T8. The maximum worst-case voltage drop across R8 is 0.7 V when all the LEDs are on, but it has increasingly less effect as the input voltage rises.
R8 is necessary so the base voltage can be regulated. R7 is fitted in series with LED D7 and Zener diode D13, and the voltage drop across R7 is used to cause transistor T7 to conduct. This voltage may be around 0.3 V at very low current levels, but with a current of a few mili-amperes it can be assumed to be 0.6 V. Transistor T7 starts conducting if the input voltage rises above the threshold voltage of D7 and D13, and this reduces the voltage on the base of T8. This negative feedback stabilizes the supply voltage for the LEDs at a level of around 30 V. With a value of 390 Ω for R7, the current through LED D7 will be slightly more than 1 mA.
This has been done intentionally so D7 will be a bit brighter than the other LEDs when the signal level is above 30 V. When the voltage is higher than 30 V, the schema draws additional current due to the voltage drop across R8. The AC voltage on the loudspeaker terminals is half-wave rectifi ed by diode D14. This standard diode can handle 1 A at 400 V. The peak current level can be considerably higher, but don’t forget that the current still has to be provided by the fi nal amplifier.
Resistor R9 is included in series with the input to keep the additional load on the fi nal amplifi er within safe bounds and limit the interference or distortion that may result from this load. The peak current can never exceed 1.5 A (the charging current of C1), even when the schema is connected directly to an AC voltage with an amplitude of 60 V. C1 also determines how long the LEDs stay lit. This brings us to an important aspect of the schema, which you may wish to experiment with in combination with the current through the LEDs.
An important consideration in the schema design is to keep the load on the fi nal amplifi er to a minimum. However, the combination of R9 and C1 causes an averaging of the complex music signal. The peak signal levels in the music are higher (or even much higher) than the average value. Tests made under actual conditions show that the applied peak power can easily be a factor of 2 to 4 greater than what is indicated by this VU meter. This amounts to 240 W or more with an 8-Ω loudspeaker.
You can reduce the value of C1 to make the schema respond more quickly (and thus more accurately) to peak signal levels. Now a few comments on D8. You may receive a stabistor (for example, from the Philips BZV86 series or the like) for D8. Unlike a Zener diode, a stabistor must be connected in the forward-biased direction. A stabistor actually consists of a set of PN junctions in series (or ordinary forward-biased diodes). Check this carefully: if D2 does not light up when D8 is fi tted as a normal Zener diode, then D8 quite likely a stabistor, so you should fi t it the other way round.
Read More..

Simple Audio Meter Wiring diagram Schematic

This is an audio meter, a kind of decibel simpler, used to measure the sound directly in the schema or a sound output device. It is very simple, using only two transistors BC107, potentiometer VR2 adjusts the input level and the level of VR1 VU. This meter audio should only be used for bench testing and should not be used for calibration.


Simple Audio Meter Circuit Diagram

Simple


Simple Audio Meter Circuit Diagram
Read More..

Tuesday, August 26, 2014

VU meter

This circuit can control analog moving coil meters, for use as a VU meter. The circuit is left connected to the line terminals of the amplifier. VU meter works pretty simple. T1 and T2 increase the signal strength. The signal is then rectified by the two diodes and applied to the meter. The capacitors C3 and C4 ensure that the voltage is slightly flattened and the meter responds less quickly.  After building the circuit, it must be calibrated. For this purpose, the VU meter connected to a tone generator which delivers 0.3V at 1000 Hz. Then P1 is fully open, that is to say that the wiper of P1 is located at the entrance. Then P2 is so cut that regulates the meter full deflection. P1 is then adjusted so that meter reads 0.5 mA (= half the maximum). 
For a stereo VU meter circuit to be built twice.

  • R1 = 1 M
  • R2 = 820 Ω
  • R3 = 2,2 kohm
  • P1, P2 = 100 k
  • C1 = 330 nF
  • C2 = 22 uF
  • C3 = 1 uF
  • C4 = 470 uF
  • T1, T2 = BC 547B
  • M1 = 1 mA meter
Read More..